The idea is to explore the use of Elasticsearch to index live monitoring events coming from various sources. We are not talking here about metrics nor historical data, just live monitoring events with key properties like « a what » or a state. At ZENETYS most of our customers have Nagios-based on-premises solutions; they send us check results via syslog through a secure tunnel so we can watch their infrastructure and maintain it operational. We decided to reuse these logs for the purpose of our little experiment.
Scope of the POC:
- again, this is just a proof-of-concept;
- receive Nagios check results, maintain an Elasticsearch index with live monitoring events;
- import extra data to the documents using a TSV file;
- basic notion of state change and problem acknowledgement;
- study the device/indicator relations;
- see what we can do with Kibana.
What this POC do not address:
- scalability, failover or queuing issues;
- notifications;
- time-based metrics data, KPI or meta-indicators;
- archiving of monitoring events or state changes over time;
- benchmarking.
Flow overview
The whole experiment was setup on a single host. We want to receive monitoring events (here, Nagios check results) via syslog and index them into Elasticsearch. At first glance we could think of a setup with a Rsyslog daemon on the receiving side; the logs would be parsed into JSON objects using mmnormalize then sent to Elasticsearch using the omelasticsearch module of Rsyslog:

That won’t work, or rather that won’t do what we want. It would accumulate all events in the Elasticsearch index because omelasticsearch performs index operations, not updates. What we are seeking is to maintain an index with a live representation of our monitoring scope, thus we need to be able to perform updates on existing documents.
Could we modify omelasticsearch to do that? Sure, but we all know that eventually we would end-up adding another piece to the puzzle, something designed to address monitoring oriented needs like state change detection, confirmation, notification, KPI update… in other words, a monitoring engine. There are interests in having an independent layer between the messaging and the memory layers; also it leaves a door open for later experiments with distributed message broker technologies.
So for the purpose of this proof-of-concept we just added a layer between Rsyslog and Elasticsearch, the monitoring engine! Well, since it is not very smart (at all), event proxy is a more accurate name for it:

Raw events parsing
Rsyslog is on the receiving side. We use liblognorm and the mmnormalize module to parse messages, producing key/value pairs. We also abstract Nagios-specific concepts by replacing the host/service terms with device/indicator and by translating states with the following precedence: 3 (CRITICAL, DOWN) > 2 (WARNING) > 1 (UNKNOWN, UNREACHABLE) > 0 (OK, UP).
The process turns a raw monitoring event like this:
[1515980613] PROCESS_SERVICE_CHECK_RESULT;helium.zenetys;PROC-haproxy;0;PROC OK: haproxy: OK|
…into a JSON object ready to be sent to the event proxy:
{
    "output": "PROC OK: haproxy: OK",
    "state": 0,
    "indicator": "PROC-haproxy",
    "device": "helium.zenetys",
    "datetime_reported": "2018-01-15T01:43:33Z",
    "datetime_received": "2018-01-15T02:43:36.833085+01:00",
    "src_host": "10.0.1.11",
    "src_format": "nagios"
}
Indexing of time-based metrics is not in the scope of this POC, so here we won’t work with Nagios check results perfdata strings.
On output, events get sent to the proxy via HTTP using… omelasticsearch! We could have used another way to transport the data; but again, we are just exploring. The Rsyslog output action was setup with a LinkedList queue capable of holding 25k entries. So with about 25 events per seconds measured here, we should be able to hold the data about 15 minutes without loss if the proxy gets stopped.
Event proxy
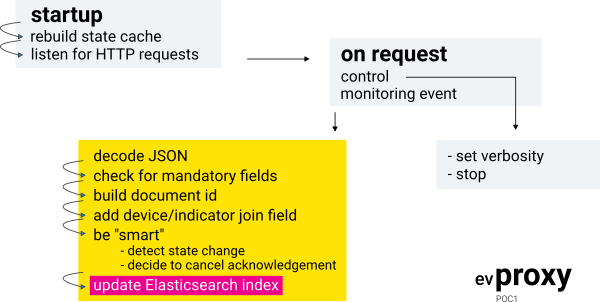
We wrote a piece of code with NodeJS that listens for monitoring events sent by Rsyslog as JSON objects (see above) over HTTP. On the other side, events are forwarded to Elasticsearch as update requests.

When indexing logs, we usually let Elasticsearch generate _id values on documents creation. In this case we need to be able to target update requests for specific documents, so naturally we use the device/indicator pair as _id. Update requests are performed with the doc_as_upsert option, so we do not need to worry about new inserts vs updates. In the end, we maintain a live monitoring index, where each document represents a monitored object in its last known state.
Even though we want to quit Nagios concepts, in this experiment we are still dealing with two main types of monitoring objects: devices and indicators. Several indicators (eg: load average, disk, ping, process, scenario, etc) may be linked to the same device. In other words, with this model, there is a parent/child relation between device/indicator objects. That relation can be indexed in Elasticsearch using a join field, with one limitation, a parent document and its children documents must be indexed on the same shard. To make it simple in this POC, our monitoring index has a single shard and update requests are performed with a routing value set to 1.
The questions we wanted to address with that join field were:
- will this relation allow to search the index with parent/child criteria?
- is it possible to include parent fields in the results of a search matching children documents?
We wanted to have a very basic state change detection mechanism. The experiment is not about scalability and works with a single event proxy instance, so we simply added an in-memory cache to store the last state received for each monitored object. When processing new events, if a change of state is detected, we update a last_received_state_change field with the time of the event. To avoid resets of that field after a restart of the event proxy, we just rebuild the cache from Elasticsearch before processing any event.
Basic problem acknowledgement was implemented with a ack field, which we assumed can be set on documents by a third party. In other words, handling of acknowledgement requests was not implemented in the event proxy, on purpose for this experiment. The only operation done by the event proxy is to drop the acknowledgement (i.e. drop the flag) on a « OK to ERROR » or a « ERROR to OK » state change transition. It led us to establish that Elasticsearch updates with both fields value change and fields removal could only be done in two operations, but still in a single requests when using the bulk API.
Event proxy output:
[jthomas@jth-es1 evproxy-poc1]$ VERBOSE=1 ./evproxy.js
2018-01-24T00:57:02.605+01:00 INFO: EV cache load done 64/6359
2018-01-24T00:57:02.613+01:00 INFO: SR server listening on 127.0.0.1:56789
...
2018-01-24T00:57:04.822+01:00 INFO: EV 200/16/1/0 2/18/5822 fw-creteil.acme1/DISK
2018-01-24T00:57:04.892+01:00 INFO: EV 200/16/1/0 1/18/72892 SW-5BC-ZWB-4.acme2/PING
2018-01-24T00:57:05.026+01:00 INFO: EV 200/15/1/0 0/17/16026 LOTUS2356.acme3/CLOCK
2018-01-24T00:57:05.030+01:00 INFO: EV state change 2018-01-24T00:57:05.028+01:00/0 olfeo2.acme4/PROC-winbindd
2018-01-24T00:57:05.050+01:00 INFO: EV 200/18/1/0 0/19/6090 olfeo2.acme4/PROC-winbindd
2018-01-24T00:57:05.221+01:00 INFO: EV 200/14/1/0 0/16/6221 FW_LANCELOT.acme5
2018-01-24T00:57:05.271+01:00 INFO: EV 200/18/1/0 0/20/6271 SBQ5-2610-24-ZACK5.acme5/UPTIME
...
Event indexation requests status and stats:
-
-
- status_code: HTTP status code returned by Elasticsearch;
- took: Process time in milliseconds, as reported by Elasticsearch;
- num_updates: Number of update operations;
- num_error: Number of update errors;
- queue_length: Number of events in queue ready for HTTP post to Elasticsearch;
- received_latency: Elaspsed time in milliseconds since the raw event was received (here from rsyslog);
- reported_latency: Elaspsed time in milliseconds since the time reported in the raw event (subject to potential clock differences);
- device: Name of the device the event is related to;
- indicator: Name of the indicator the event is related to.
-
Index mapping
The following is a sample document from the monitoring index:
{
    "_index": "monitoring",
    "_type": "events",
    "_id": "ts13267_xyzentrepot_disk",
    "_score": null,
    "_routing": "1",
    "_source": {
        "indicator": "DISK",
        "datetime_reported": "2018-01-24T18:30:53Z",
        "src_format": "nagios",
        "src_host": "192.168.33.21",
        "output": "DISK OK: C: 81%=55.42GB, D: 84%=26.03GB",
        "state_count": 5660,
        "datetime_received": "2018-01-24T19:30:59.332956+01:00",
        "state": 0,
        "last_received_state_change": "2018-01-04T21:00:29.740331+01:00",
        "device": "ts13267.xyzentrepot",
        "device_indicator_join": {
            "parent": "ts13267.xyzentrepot",
            "name": "indicator"
        },
        "device_ip": "10.109.21.42",
        "contact_phone": "09.99.99.99.99",
        "contact_email": "techs@xyzentrepot.fr",
        "device_type": "W2008R2"
    }
}
The index mapping mixes explicit definitions for main fields, and dynamic templates to support the addition of extra data with a type hinting based on field names. It was difficult to guarantee the order of evaluation of dynamic templates when mixing rules with different match_pattern or match_mapping_type values; we managed to solve this by using regex-based match rules exclusively.
We wrote another tool, mdupdate, to inject extra metadata in documents. It is run periodically via cron and takes a TSV file as input that we generate from our database. Since a device has many indicators, we would naturally store common metadata on devices documents only; this is our « natural » way of thinking relational. However, we were not able to make Elasticsearch return fields from parent documents (devices) in searches resulting in child documents (indicators). As it is well explained in this page, we have to make a compromise between application-side joins and data denormalization; in this experiment we chose to repeat the data.
Sample TSV input:
device              device_ip      device_type  device_site   contact_email      contact_phone
ALOHA-EXCH-1.acme3  10.109.21.231  ALOHA        Paris         support@acme3.com  09.99.99.99.99
ALOHA-EXCH-2.acme3  10.109.21.232  ALOHA        Marseille     support@acme3.com  09.99.99.99.99
...
Queries, views and expiration
We were able to write a query that returns confirmed alerts sorted by priority and duration, excluding acknowledged ones and indicators in error if their device object is also in error. The confirm condition is very basic: the state change must be old of 5 minutes minimum. This query makes use of the join field holding the device/indicator relation.
Other listing-oriented queries:
- Return all events, sorted by priority and duration;
- Return all unconfirmed state changes (same basic condition as explained above).
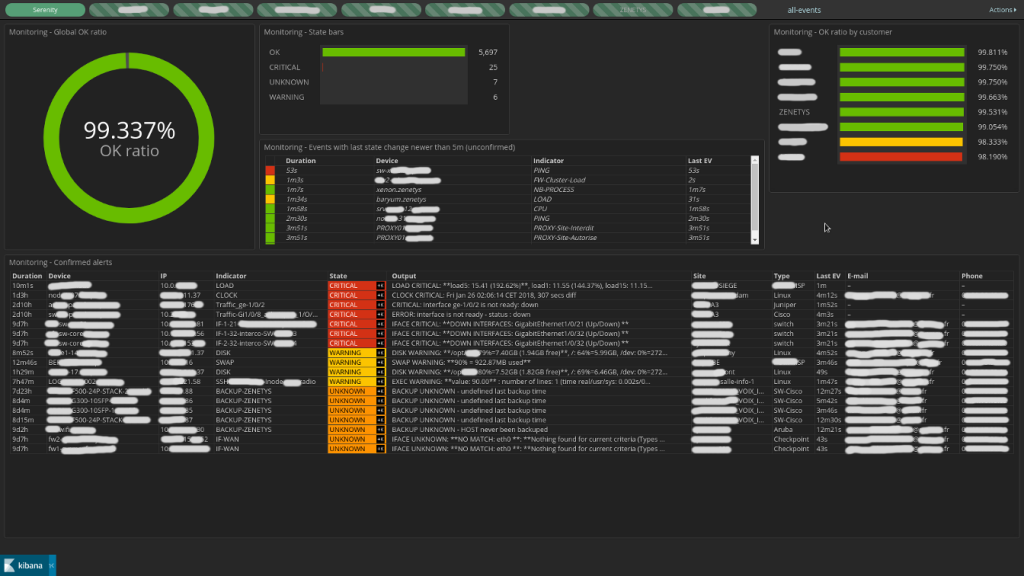
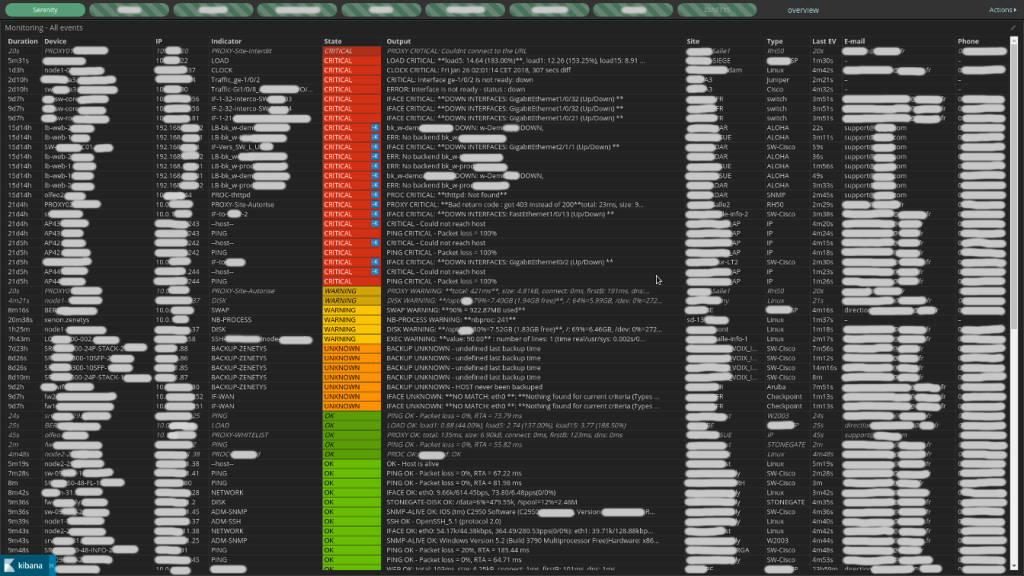
We were looking for a quick way of representing the content of the index, wondering what we could get with Kibana. In particular, we wanted to display tables resulting from the three queries mentioned above. It became easy when we found the brilliant transform_vis plugin from Jay Greenberg. With a bit of work, and a lot of hugly stuff, we where were able to produces the listings and came up with these two dashboards:


The main table from the overview page shows confirmed unacknowledged alerts. The +K buttons in the state column allow to acknowledge problems, by setting the ack flag on the corresponding documents, removing them from the listing. We also added a few native Kibana visualisations and some shortcuts to filters between customers. The second page displays all events, no matter the state, with +K buttons to drop the ack flag from acknowledged entries.
Because monitored objects always changes, we wrote a tool, evexpire, that removes old entries from the monitoring index. We run it periodically via cron to remove documents not updated for two days.
Where to go from there?
Now it would be interesting to play with metrics data, with focus on storage, alerting or KPI computations. For instance, we could test raw or computed metrics against thresholds or abnormal behavior, then generate new events, hence new indicators. Also, we would like to study on how to address scalability issues, explore on queuing and event brokers, make benchs, etc.
Source code for the whole proof-of-concept is available on Github in evproxy-poc1 repository.
The technologies played with here are moving fast! Here we used:
- Rsyslog 8.29.0 + a few backported patches, liblognorm 2.0.4;
- Elasticsearch 6.1.1, Kibana 6.1.1 + patches from Rob Cowart to fix a few styling issues + transform_vis 6.1.1;
- NodeJS 9.3.0.


